Learning Shiny with the Spline Tool
Background
My current project is about to produce a Giant Heap of data for end users to play with, and I’m concerned that it might be a bit overwhelming to digest. Even I’m having trouble trawling through it all to make sure everything is correct. A web app that allows the user to drill into that heap and just pull out what they need may be necessary…better learn how to build one, I guess!
I’ve done just about everything else for the project in R, so I figured I’d maintain consistency and learn Shiny. As a bit of a ‘Hello World’ project, I decided to try and replicate a small standalone app used by soil scientists to pre-process soil laboratory data.
Soil lab data is collected on a sample basis: you dig your hole, you grab ~200-500g of soil within a set of given depth ranges, you bag the samples up, and send them to the lab. Budget and time constraints generally mean that you don’t get to sample every depth interval in a profile, so you must attempt to pick representative depth ranges. Best practice is one sample per horizon and/or one every half a metre or so, if the horizon is thick. It’s also good to grab one at the surface, and one at top of the B horizon, as the most interesting things tend to happen there (and as a result, data from those parts of the profile are often used in classification systems).
The result is a huge store of soil data that only ‘exists’ for part of each profile. I might have pH values for 0-10cm, 20-30, 50-60, 80-90, and 110-120, but I only have data for those depth slices. This makes it difficult to compare profiles from different locations, and it makes environmental modelling almost impossible.
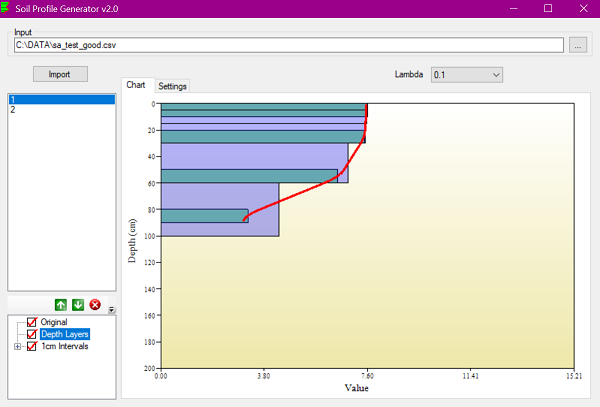
The standard solution is to use a mass-preserving spline to interpolate between the available data, and produce estimates of mean values for continuous depth sections down the profile. The idea entered the scientific literature with Bishop, McBratney and Laslett’s 1999 paper Modelling soil attribute depth functions with equal-area quadratic smoothing splines and became standard practice fairly quickly. In the mid-2000’s the CSIRO-funded Australian Collaborative Land Evaluation Program (ACLEP) team released a standalone app to do the job, I suspect in response to too many homebrew implementations floating around. The app made certain that everyone doing splining would get the same results from a given dataset, and this was a big deal as the drive was on to produce unified national datasets like the Australian Soil Resource Information System (ASRIS) and, later, the Soil and Landscape Grid of Australia.

The standalone app is still available from the ASRIS website, but ACLEP and ASRIS are sadly underloved these days and I don’t know how much longer they’ll be around. The app itself hasn’t been updated since ~2012 - the authors may have jinxed themselves by promising regular updates in the metadata :P.
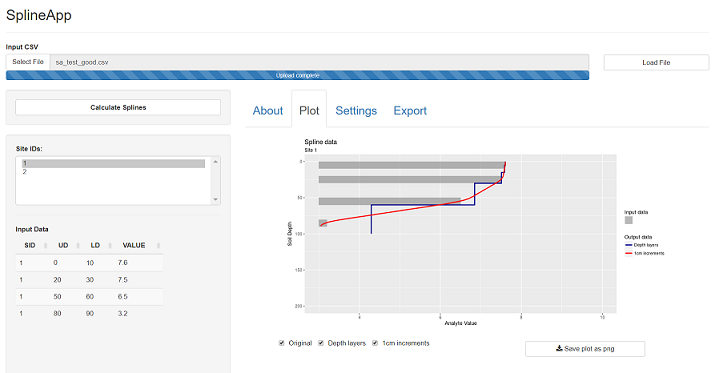
Luckily, the core functionality of SplineTool has been replicated in R, with GSIF::mpsline. That means all I had to do is wrap that function up in a web-app interface that mimics the existing tool. ‘Hello World’, indeed.
The webapp is now online at https://obrl-soil.shinyapps.io/splineapp/, so check it out and let me know what you think. Hopefully its of use to people who can’t run the existing app, or don’t want to learn R just to get this one task done. It has all the original app features, except for RMSE and ‘singles reports’, which mpspline doesn’t produce. To make up for it, you can view outputs as well as inputs by site, save plots, and either download .csv outputs or an .rds containing the complete object output by mpspline.

Read on if you care about how I got it working…
Process
I allowed myself a week to do this, and spent… probably a solid 24 hours of that on the app, mostly because I have no self control. At least half of that was dicking around with the UI styling, I must admit, but there was still a fairly steep learning curve to negotiate.
I went in to this with intermediate R skills and pretty basic html/css - I’d played around with making websites as a teenager mumble years ago, and then did the first few modules of freecodecamp’s course back in March before getting distracted and wandering off. The basic knowledge of Bootstrap I picked up there really helped, though.
The offical documentation and tutorials for Shiny are very good, so just working through them step by step got me most of the way there. For the rest, StackOverflow generally came to the rescue. This question about users adding to a list of values helped me implement custom output depth ranges, and this one got me a ‘save plots’ option, which the original app didn’t have.
There’s still a few things I couldn’t manage to crack, notably the ability to handle more flexible inputs. I wanted to be able to get the user to identify the input columns appropriately, rather than relying on a strictly formatted input dataset. Being able to upload a file with multiple attribute columns and then pick which to spline would have been nice. Oh well, there’s always version 2.0… jinx!
The source code is on my github, if you have any ideas for improvement I’d love to hear them.
Citation
@unpublished{o'brien2017,
  author = {O’Brien, Lauren},
  title = {Learning {Shiny} with the {Spline} {Tool}},
  date = {2017-10-22},
  url = {https://obrl-soil.github.io/posts/2017-10-22_learning-shiny/},
  langid = {en}
}